Clustering Described
After Supervised Learning algorithms, it’s time to have a look at the most popular Unsupervised method. Here, we present to you - Clustering, and it’s variants.
Let’s look at it’s simplicity here
In our daily life, we group different activities according to their utility. This grouping is what you need to learn.
A winner is just a loser who tried one more time. Keep trying.
What is Clustering?
How does a recommendation system work?
How does a company decide the location for their new store so as to generate** maximum **profit?
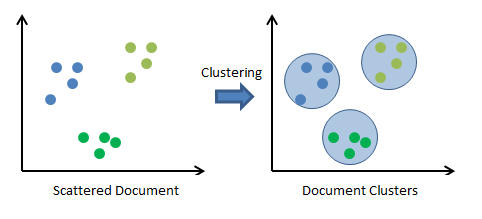
It’s an unsupervised learning algorithm which groups the given data, such that data points with similar behaviour are merged into one group.
Main aim is to segregate the various data points into different groups called clusters such that entities in a particular group comparatively have more similar traits than entities in another group. *At the end, each data point is assigned to one of the group.
Clustering algorithm does not predict an outcome or target variable but can be used to improve predictive model. Predictive models can be built for clusters to improve the accuracy of our prediction.
Types of Clustering
There exist more than 100 clustering algorithms as of today. Some of the commonly used are k-Means, Hierarchical, DBSCAN and OPTICS. Two of these have been covered here:
1. Hierarchical Clustering
It is a type of connectivity model clustering which is based on the fact that data points that are closer to each other are more similar than the data points lying far away in a data space.
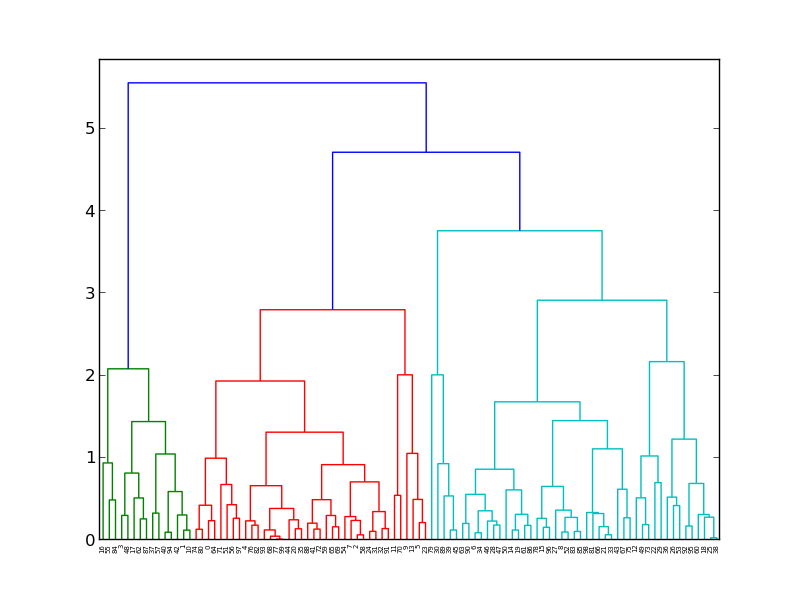
As the name speaks for itself, the hierarchical clustering forms the hierarchy of the clusters that can be studied by visualising dendogram.
How to measure closeness of points?
| Euclidean distance: | a-b | 2 = √(Σ(ai-bi)) |
| Squared Euclidean distance: | a-b | 22 = Σ((ai-bi)²) |
| Manhattan distance: | a-b | ¹ = Σ | ai-bi |
| Maximum distance: | a-b | ^inf = maxi | ai-bi |
Mahalanobis distance: √((a-b)T S-1 (-b)) {where, s : covariance matrix}
How to calculate distance between two clusters?
Centroid Distance: Euclidean distance between mean of data points in the two clusters
Minimum Distance: Euclidean distance between two data points in the two clusters that are closest to each other
Maximum Distance : Euclidean distance between two data points in the two clusters that are farthest to each other
Focus on Centroid Distance right now!
Algorithm Explained
-
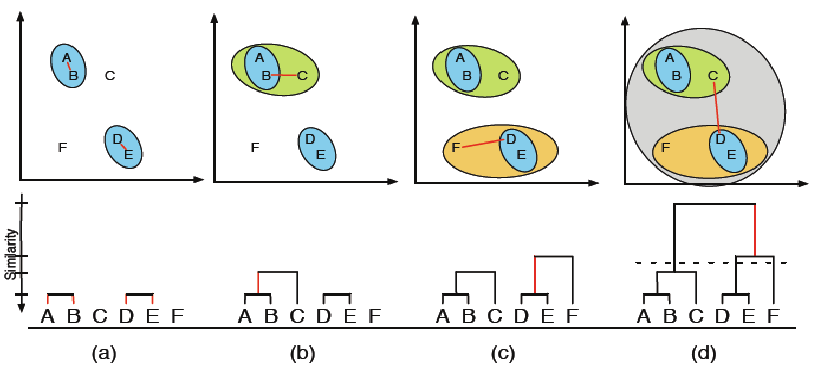
Let there be N data points. Firstly, these N data points are assigned to N different clusters with one data point in each cluster.
-
Then, two data points with minimum euclidean distance between them are merged into a single cluster.
-
Then, two clusters with minimum centroid distance between them are merged into a single cluster.
-
This process is repeated until we are left with a single cluster, hence forming hierarchy of clusters.
How many clusters to form?
-
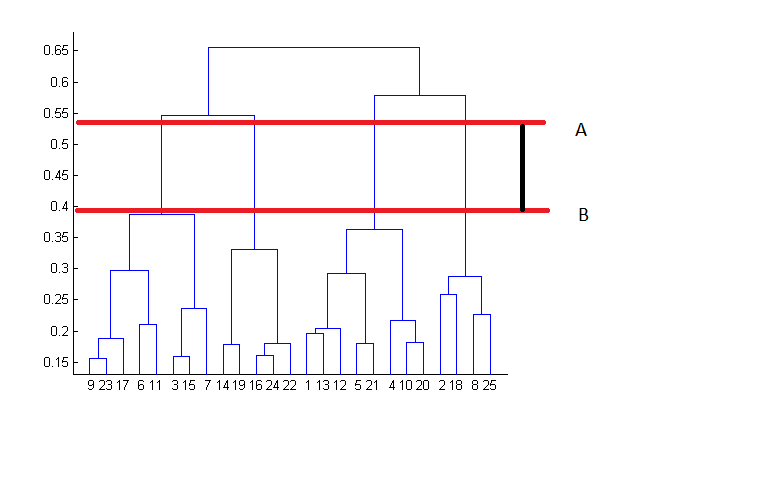
Visualising dendogram: Best choice of no. of clusters is no. of vertical lines that can be cut by a horizontal line, that can transverse maximum distance vertically without intersecting other cluster. For eg., in the below case, best choice for no. of clusters will be 4.
-
Intuition and prior knowledge of the data set.
Good Cluster Analysis
Data-points within same cluster share similar profile: Statistically, check the standard deviation for each input variable in each cluster. A perfect separation in case of cluster analysis is rarely achieved. Hence, even one standard deviation distance between two cluster means is considered to be a good separation.
Well spread proportion of data-points among clusters: There are no standards for this requirement. But a minimum of 5% and maximum of 35% of the total population can be assumed as a safe range for each cluster.

K-Means Clustering
One of the simplest and most widely used unsupervised learning algorithm. It involves a simple way to classify the data set into fixed no. of K clusters . The idea is to define K centroids, one for each cluster.
The final clusters depend on the initial configuration of centroids. So, they should be initialized as far from each other as possible.
K-Means is iterative in nature and easy to implement.
Algorithm Explained
Let there be N data points. At first, _K _centroids are initialised in our data set representing *K *different clusters.
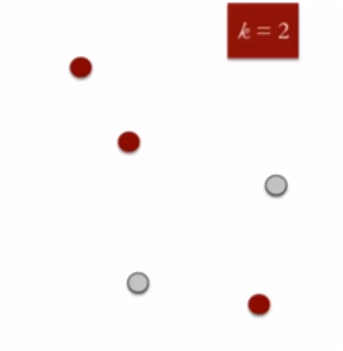
Now, each of the N data points are assigned to closest centroid in the data set and merged with that centroid as a single cluster. In this way, every data point is assigned to one of the centroids.
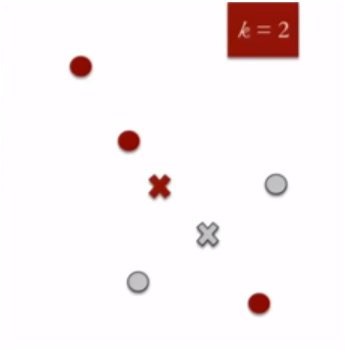
Then, K cluster centroids are recalculated and again, each of the N data points are assigned to the nearest centroid.
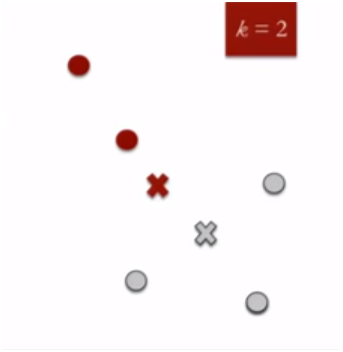
Step 3 is repeated until no further improvement can be made.
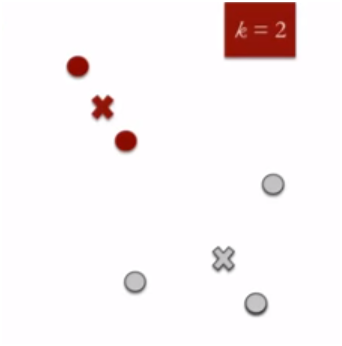
In this process, a loop is generated. As a result of this loop, K centroids change their location step by step until no more change is possible.
This algorithm aims at minimising the objective function:
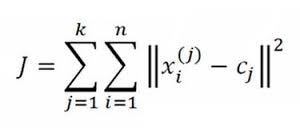
It represent the sum of** euclidean distance** of all the data points from the cluster centroid which is minimised.

How to initialize K centroids?
-
Forgy: Randomly assigning K centroid points in our data set.
-
Random Partition: Assigning each data point to a cluster randomly, and then proceeding to evaluation of centroid positions of each cluster.
-
KMeans++: Used for small data sets.
-
Canopy Clustering: Unsupervised pre-clustering algorithm used as preprocessing step for K-Means or any Hierarchical Clustering. It helps in speeding up clustering operations on large data sets.
How to calculate centroid of a cluster?
Simply the mean of all the data points within that cluster.
How to find value of K for the dataset?
In K-Means Clustering, value of _K _has to be specified beforehand. It can be determine by any of the following methods:
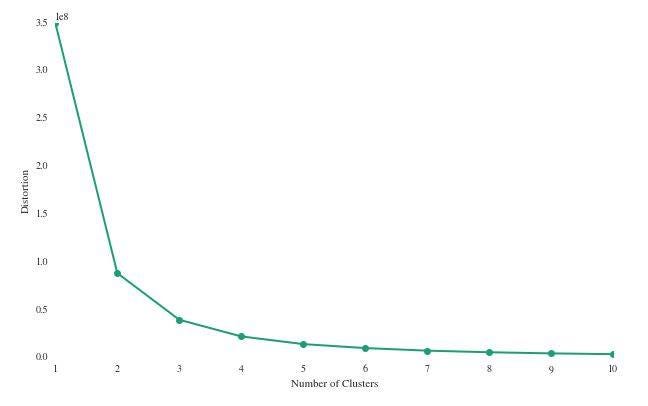
Elbow Method: Clustering is done on a dataset for varying values of and SSE (Sum of squared errors) is calculated for each value of K. Then, a graph between K and SSE is plotted. Plot formed assumes the shape of an arm. There is a point on the graph where SSE does not decreases significantly with increasing K. This is represented by elbow of the arm and is chosen as the value of K. (OPTIMUM)

Silhouette Score: Used to study the separation distance between the resulting clusters. The silhouette plot displays a measure of how close each point in one cluster is to points in the neighbouring clusters. Click here for complete explanation of the method.

K-Means v/s Hierarchical
-
For big data, K-Means is better! Time complexity of K-Means is linear, while that of hierarchical clustering is quadratic.
-
Results are reproducible in Hierarchical, and not in K-Means, as they depend on intialization of centroids.
-
K-Means requires prior and proper knowledge about the data set for specifying K. In Hierarchical, we can choose no. of clusters by interpreting dendogram.
References AV’s Blog on Clustering
Blog on K-Means by Akhil Gupta
Python Machine Learning by Sebastian Raschka
Footnotes You are getting richer day-by-day. 7 down, 5 more to go! Start applying for internships. You can rock the interviews. Just stick to 12A12D.
Thanks for reading. :) And, ❤ if this was a good read. Enjoy!
Co-Authors: Nishant Raj and Pranjal Khandelwal